Heart disease prediction

Machine learning & AI
Author

Saugat

Published

June 3, 2021

This notebook looks into using various Python-based machine learning and data science libraries in an attempt to build a machine learning model capable of predicting whether someone has heart disease based on their medical attributes

we’re going to take following approach: 1. Problem definition 2. Data 3. Evaluation 4. Features 5. Modeling 6. Experimentation

1. Problem definition

In a statement, > Given clinical parameters about a patient, can we predict a patient has heart disease.

2. Data

The original data came from the Cleavland data from UCI machine learning repository - https://archive.ics.uci.edu/ml/datasets/heart+disease

On kaggle - https://www.kaggle.com/datasets/redwankarimsony/heart-disease-data

3. Evaluation

If we can reach 95% accuracy at predicting whether or not a patient has heart disease during the proof of concept, we’ll pursue the project.

4. Features

This is where you’ll get different information about each of the features in your data

create data dictionary

  1. age - age in years
  2. sex - (1 = male; 0 = female)
  3. cp - chest pain type
    • 0: Typical angina: chest pain related decrease blood supply to the heart
    • 1: Atypical angina: chest pain not related to heart
    • 2: Non-anginal pain: typically esophageal spasms (non heart related) *3: Asymptomatic: chest pain not showing signs of disease
  4. trestbps - resting blood pressure (in mm Hg on admission to the hospital)
    • anything above 130-140 is typically cause for concern
  5. chol - serum cholestoral in mg/dl
    • serum = LDL + HDL + .2 * triglycerides
    • above 200 is cause for concern
  6. fbs - (fasting blood sugar > 120 mg/dl) (1 = true; 0 = false)
    • ‘>126’ mg/dL signals diabetes
  7. restecg - resting electrocardiographic results
    • 0: Nothing to note
    • 1: ST-T Wave abnormality
      • can range from mild symptoms to severe problems
      • signals non-normal heart beat
    • 2: Possible or definite left ventricular hypertrophy
      • Enlarged heart’s main pumping chamber
  8. thalach - maximum heart rate achieved
  9. exang - exercise induced angina (1 = yes; 0 = no)
  10. oldpeak - ST depression induced by exercise relative to rest
    • looks at stress of heart during excercise
    • unhealthy heart will stress more
  11. slope - the slope of the peak exercise ST segment
    • 0: Upsloping: better heart rate with excercise (uncommon)
    • 1: Flatsloping: minimal change (typical healthy heart)
    • 2: Downslopins: signs of unhealthy heart
  12. ca - number of major vessels (0-3) colored by flourosopy
    • colored vessel means the doctor can see the blood passing through
  13. thal - thalium stress result
    • 1,3: normal
    • 6: fixed defect: used to be defect but ok now
    • 7: reversable defect: no proper blood movement when excercising
  14. target - have disease or not (1=yes, 0=no) (= the predicted attribute)

Preparing the tools

we’re going to use pandas, matplotlib and Numpy for data analysis and manipulation

Code
# import all the tools

# Regular EDA(exploratory data analysis) and plotting library
import numpy as np
import pandas as pd 
import matplotlib.pyplot as plt
import seaborn as sns

#we want our plots to appear inside the notebook
%matplotlib inline 

# models from scikit-learn
from sklearn.linear_model import LogisticRegression
from sklearn.neighbors import KNeighborsClassifier
from sklearn.ensemble import RandomForestClassifier

# model evaluations 
from sklearn.model_selection import train_test_split, cross_val_score
from sklearn.model_selection import RandomizedSearchCV, GridSearchCV
from sklearn.metrics import confusion_matrix, classification_report
from sklearn.metrics import precision_score, recall_score, f1_score
from sklearn.metrics import RocCurveDisplay

Load data

Code
df = pd.read_csv("data/heart-disease (1).csv")
df.shape
(303, 14)

Data Exploration ( Exploratory data analysis or EDA)

The goal here is to find out more about the data and become a subject matter export on the dataset you’re working with

  1. What question(s) are you trying to solve (or prove wrong)?
  2. What kind of data do you have and how do you treat different types?
  3. What’s missing from the data and how do you deal with it?
  4. Where are the outliers and why should you care about them?
  5. How can you add, change or remove features to get more out of your data?
Code
df.head()
age sex cp trestbps chol fbs restecg thalach exang oldpeak slope ca thal target
0 63 1 3 145 233 1 0 150 0 2.3 0 0 1 1
1 37 1 2 130 250 0 1 187 0 3.5 0 0 2 1
2 41 0 1 130 204 0 0 172 0 1.4 2 0 2 1
3 56 1 1 120 236 0 1 178 0 0.8 2 0 2 1
4 57 0 0 120 354 0 1 163 1 0.6 2 0 2 1
Code
#lets find out how many of each class exists
df.target.value_counts()
target
1    165
0    138
Name: count, dtype: int64
Code
df.target.value_counts().plot(kind = "bar", color = ["salmon","lightblue"])
<Axes: xlabel='target'>

Code
df.info()
<class 'pandas.core.frame.DataFrame'>
RangeIndex: 303 entries, 0 to 302
Data columns (total 14 columns):
 #   Column    Non-Null Count  Dtype  
---  ------    --------------  -----  
 0   age       303 non-null    int64  
 1   sex       303 non-null    int64  
 2   cp        303 non-null    int64  
 3   trestbps  303 non-null    int64  
 4   chol      303 non-null    int64  
 5   fbs       303 non-null    int64  
 6   restecg   303 non-null    int64  
 7   thalach   303 non-null    int64  
 8   exang     303 non-null    int64  
 9   oldpeak   303 non-null    float64
 10  slope     303 non-null    int64  
 11  ca        303 non-null    int64  
 12  thal      303 non-null    int64  
 13  target    303 non-null    int64  
dtypes: float64(1), int64(13)
memory usage: 33.3 KB
Code
df.isna().sum()
age         0
sex         0
cp          0
trestbps    0
chol        0
fbs         0
restecg     0
thalach     0
exang       0
oldpeak     0
slope       0
ca          0
thal        0
target      0
dtype: int64
Code
df.describe()
age sex cp trestbps chol fbs restecg thalach exang oldpeak slope ca thal target
count 303.000000 303.000000 303.000000 303.000000 303.000000 303.000000 303.000000 303.000000 303.000000 303.000000 303.000000 303.000000 303.000000 303.000000
mean 54.366337 0.683168 0.966997 131.623762 246.264026 0.148515 0.528053 149.646865 0.326733 1.039604 1.399340 0.729373 2.313531 0.544554
std 9.082101 0.466011 1.032052 17.538143 51.830751 0.356198 0.525860 22.905161 0.469794 1.161075 0.616226 1.022606 0.612277 0.498835
min 29.000000 0.000000 0.000000 94.000000 126.000000 0.000000 0.000000 71.000000 0.000000 0.000000 0.000000 0.000000 0.000000 0.000000
25% 47.500000 0.000000 0.000000 120.000000 211.000000 0.000000 0.000000 133.500000 0.000000 0.000000 1.000000 0.000000 2.000000 0.000000
50% 55.000000 1.000000 1.000000 130.000000 240.000000 0.000000 1.000000 153.000000 0.000000 0.800000 1.000000 0.000000 2.000000 1.000000
75% 61.000000 1.000000 2.000000 140.000000 274.500000 0.000000 1.000000 166.000000 1.000000 1.600000 2.000000 1.000000 3.000000 1.000000
max 77.000000 1.000000 3.000000 200.000000 564.000000 1.000000 2.000000 202.000000 1.000000 6.200000 2.000000 4.000000 3.000000 1.000000

Heart disease frequency according to sex

Code
df.sex.value_counts()
df.target.value_counts()
target
1    165
0    138
Name: count, dtype: int64
Code
 pd.crosstab(df.target, df.sex)
sex 0 1
target
0 24 114
1 72 93
Code
pd.crosstab(df.target,df.sex).plot(kind = "bar",
                                  color =["salmon","lightblue"],
                                  figsize =(10,6))
plt.title("Heart Disease Frequency for sex")
plt.xlabel("0 = No disease, 1 = disease")
plt.ylabel("Amount")
plt.legend(["Female","Male"]);
plt.xticks(rotation=0)
(array([0, 1]), [Text(0, 0, '0'), Text(1, 0, '1')])

Code
pd.crosstab(df.target, df.age)
age 29 34 35 37 38 39 40 41 42 43 ... 65 66 67 68 69 70 71 74 76 77
target
0 0 0 2 0 1 1 2 1 1 3 ... 4 3 6 2 1 3 0 0 0 1
1 1 2 2 2 2 3 1 9 7 5 ... 4 4 3 2 2 1 3 1 1 0

2 rows × 41 columns

Code
pd.crosstab(df.target,df.exang)
exang 0 1
target
0 62 76
1 142 23

Age vs max heart rate for heart disease

Code
# create another figure
plt.figure(figsize=(10,6))

#scatter with positive examples
plt.scatter(df.age[df.target==1],
           df.thalach[df.target==1],
           c="salmon")

#scatter with neg example
plt.scatter(df.age[df.target==0],
           df.thalach[df.target==0],
           c="lightblue");

plt.title("Heart disease in function of age and max heart rate")
plt.xlabel("Age")
plt.ylabel("Max heart rate")
plt.legend(["Disease","No disease"]);

Code
#check the distribution of the age column with a histogram
df.age.plot.hist();

Heart disease frequency per chest pain type

  1. cp - chest pain type
    • 0: Typical angina: chest pain related decrease blood supply to the heart
    • 1: Atypical angina: chest pain not related to heart
    • 2: Non-anginal pain: typically esophageal spasms (non heart related)
Code
pd.crosstab(df.cp,df.target)
target 0 1
cp
0 104 39
1 9 41
2 18 69
3 7 16
Code
#make the crosstab more visual
pd.crosstab(df.cp,df.target).plot(kind="bar",
                                 figsize =(10,6),
                                 color = ["salmon","lightblue"])
plt.title("Heart disease frequency per chest pain type")
plt.xlabel("Chest pain type")
plt.ylabel("amount")
plt.legend(["No disease","Disease"])
plt.xticks(rotation=0);

Code
# make a correlation matrix
df.corr()
age sex cp trestbps chol fbs restecg thalach exang oldpeak slope ca thal target
age 1.000000 -0.098447 -0.068653 0.279351 0.213678 0.121308 -0.116211 -0.398522 0.096801 0.210013 -0.168814 0.276326 0.068001 -0.225439
sex -0.098447 1.000000 -0.049353 -0.056769 -0.197912 0.045032 -0.058196 -0.044020 0.141664 0.096093 -0.030711 0.118261 0.210041 -0.280937
cp -0.068653 -0.049353 1.000000 0.047608 -0.076904 0.094444 0.044421 0.295762 -0.394280 -0.149230 0.119717 -0.181053 -0.161736 0.433798
trestbps 0.279351 -0.056769 0.047608 1.000000 0.123174 0.177531 -0.114103 -0.046698 0.067616 0.193216 -0.121475 0.101389 0.062210 -0.144931
chol 0.213678 -0.197912 -0.076904 0.123174 1.000000 0.013294 -0.151040 -0.009940 0.067023 0.053952 -0.004038 0.070511 0.098803 -0.085239
fbs 0.121308 0.045032 0.094444 0.177531 0.013294 1.000000 -0.084189 -0.008567 0.025665 0.005747 -0.059894 0.137979 -0.032019 -0.028046
restecg -0.116211 -0.058196 0.044421 -0.114103 -0.151040 -0.084189 1.000000 0.044123 -0.070733 -0.058770 0.093045 -0.072042 -0.011981 0.137230
thalach -0.398522 -0.044020 0.295762 -0.046698 -0.009940 -0.008567 0.044123 1.000000 -0.378812 -0.344187 0.386784 -0.213177 -0.096439 0.421741
exang 0.096801 0.141664 -0.394280 0.067616 0.067023 0.025665 -0.070733 -0.378812 1.000000 0.288223 -0.257748 0.115739 0.206754 -0.436757
oldpeak 0.210013 0.096093 -0.149230 0.193216 0.053952 0.005747 -0.058770 -0.344187 0.288223 1.000000 -0.577537 0.222682 0.210244 -0.430696
slope -0.168814 -0.030711 0.119717 -0.121475 -0.004038 -0.059894 0.093045 0.386784 -0.257748 -0.577537 1.000000 -0.080155 -0.104764 0.345877
ca 0.276326 0.118261 -0.181053 0.101389 0.070511 0.137979 -0.072042 -0.213177 0.115739 0.222682 -0.080155 1.000000 0.151832 -0.391724
thal 0.068001 0.210041 -0.161736 0.062210 0.098803 -0.032019 -0.011981 -0.096439 0.206754 0.210244 -0.104764 0.151832 1.000000 -0.344029
target -0.225439 -0.280937 0.433798 -0.144931 -0.085239 -0.028046 0.137230 0.421741 -0.436757 -0.430696 0.345877 -0.391724 -0.344029 1.000000
Code
# lets make our correlation matrix visual
corr_matrix = df.corr()
fig, ax = plt.subplots(figsize=(15,10))
ax = sns.heatmap(corr_matrix,
                 annot = True,
                 linewidths = 0.5,
                 fmt = ".2f",
                 cmap = "YlGnBu");

5. Modelling

Code
# split into X & y
X = df.drop("target", axis =1)
y = df["target"]
Code
X
age sex cp trestbps chol fbs restecg thalach exang oldpeak slope ca thal
0 63 1 3 145 233 1 0 150 0 2.3 0 0 1
1 37 1 2 130 250 0 1 187 0 3.5 0 0 2
2 41 0 1 130 204 0 0 172 0 1.4 2 0 2
3 56 1 1 120 236 0 1 178 0 0.8 2 0 2
4 57 0 0 120 354 0 1 163 1 0.6 2 0 2
... ... ... ... ... ... ... ... ... ... ... ... ... ...
298 57 0 0 140 241 0 1 123 1 0.2 1 0 3
299 45 1 3 110 264 0 1 132 0 1.2 1 0 3
300 68 1 0 144 193 1 1 141 0 3.4 1 2 3
301 57 1 0 130 131 0 1 115 1 1.2 1 1 3
302 57 0 1 130 236 0 0 174 0 0.0 1 1 2

303 rows × 13 columns

Code
y
0      1
1      1
2      1
3      1
4      1
      ..
298    0
299    0
300    0
301    0
302    0
Name: target, Length: 303, dtype: int64
Code
# split data into train and test set
np.random.seed(42)

X_train, X_test, y_train, y_test = train_test_split(X,y,test_size =0.2)
Code
X_train
age sex cp trestbps chol fbs restecg thalach exang oldpeak slope ca thal
132 42 1 1 120 295 0 1 162 0 0.0 2 0 2
202 58 1 0 150 270 0 0 111 1 0.8 2 0 3
196 46 1 2 150 231 0 1 147 0 3.6 1 0 2
75 55 0 1 135 250 0 0 161 0 1.4 1 0 2
176 60 1 0 117 230 1 1 160 1 1.4 2 2 3
... ... ... ... ... ... ... ... ... ... ... ... ... ...
188 50 1 2 140 233 0 1 163 0 0.6 1 1 3
71 51 1 2 94 227 0 1 154 1 0.0 2 1 3
106 69 1 3 160 234 1 0 131 0 0.1 1 1 2
270 46 1 0 120 249 0 0 144 0 0.8 2 0 3
102 63 0 1 140 195 0 1 179 0 0.0 2 2 2

242 rows × 13 columns

Now we’ve got our data split into train and test sets, its time to use machine learning

We’re going to try 3 different machine learning model 1. Logistic regression 2. K-Nearest Neighbours classifier 3. Random forest classifier

Code
# put models in a dictionary
models = {"logistics regression": LogisticRegression(),
         "KNN": KNeighborsClassifier(),
         "Random Forest": RandomForestClassifier()}

# creare a function to fit and score models 
def fit_and_score(models, X_train, X_test, y_train, y_test):
    """
    Fits and evaluates given machine learning models.
    models : a dict of different scikit-learn machine learning models
    X_train : training data (no labels)
    X_test : testing data (no labels)
    y_train : training labels
    y_test : test label
    """
    #set random seed
    np.random.seed(42)
    
    #set empty dict to store model scores
    model_scores = {}
    
    # looping through model dict
    for name, model in models.items():
        # fit the model
        model.fit(X_train, y_train)
        #evaluate the model
        model_scores [name] = model.score(X_test, y_test)
    return model_scores
Code
model_scores = fit_and_score(models, X_train,X_test,y_train,y_test)
model_scores
c:\Users\sauga\OneDrive\Desktop\AI & machine learning\blog\quarto-env\Lib\site-packages\sklearn\linear_model\_logistic.py:460: ConvergenceWarning: lbfgs failed to converge (status=1):
STOP: TOTAL NO. of ITERATIONS REACHED LIMIT.

Increase the number of iterations (max_iter) or scale the data as shown in:
    https://scikit-learn.org/stable/modules/preprocessing.html
Please also refer to the documentation for alternative solver options:
    https://scikit-learn.org/stable/modules/linear_model.html#logistic-regression
  n_iter_i = _check_optimize_result(
{'logistics regression': 0.8852459016393442,
 'KNN': 0.6885245901639344,
 'Random Forest': 0.8360655737704918}

Model comparison

Code
model_compare = pd.DataFrame(model_scores, index = ["accuracy"])
model_compare.T.plot.bar();

Now we’ve got a baseline model and we know model’s first predicction aren’t always final

lets look at the following: * Hyperparameter tuning * Feature importance * Confusion matrix * Cross-validation * Precision * Recall * F1 score * Classification report * ROC vurve * Area under the curve (AUC)

Hyperparameter tuning

Code
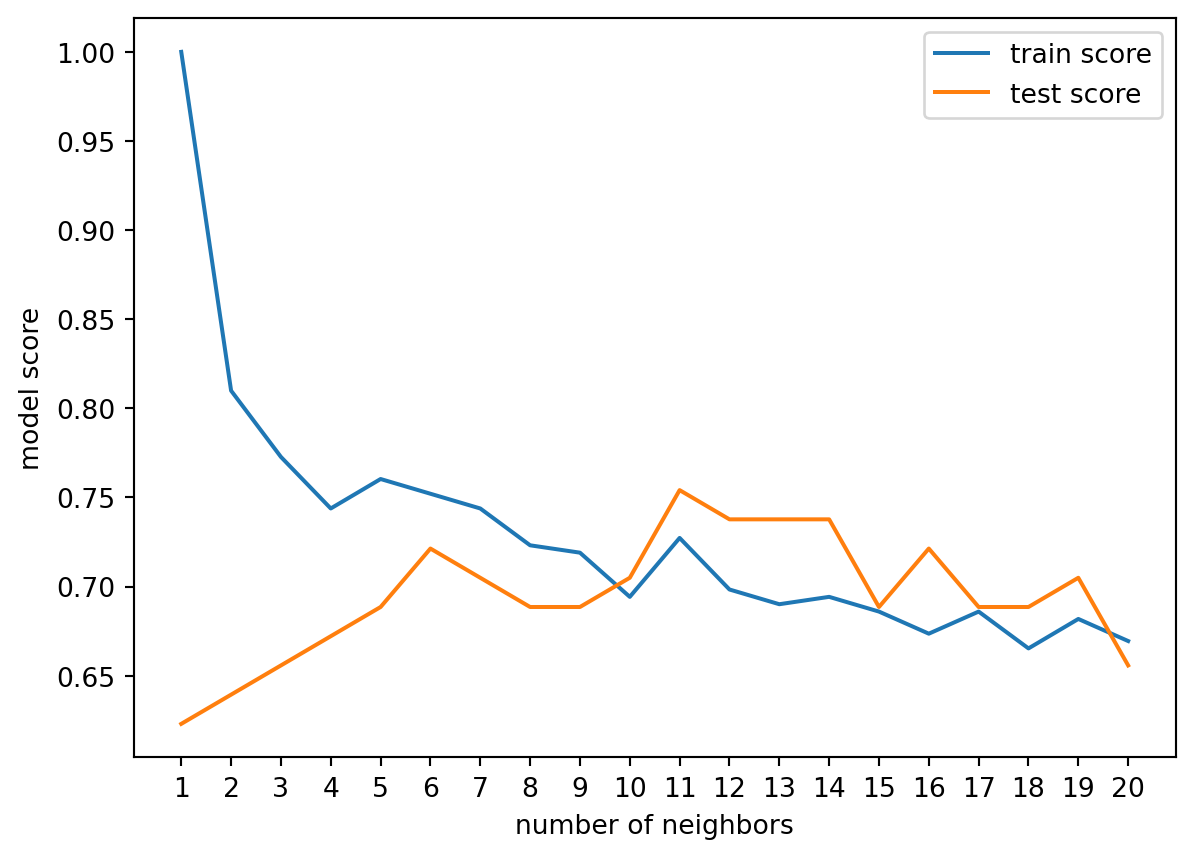
#let's tune KNN

train_scores = []
test_scores = []

# create a list of different values for n-neighbours 
neighbors = range(1,21)

# setup KNN instance
knn = KNeighborsClassifier()

# loop for different value of n-neighbours
for i in neighbors:
    knn.set_params(n_neighbors = i) # set neighbors value
    
    #fit the algorithm
    knn.fit(X_train, y_train)
    
    #update the training score 
    train_scores.append(knn.score(X_train,y_train))
    
    #update the test score 
    test_scores.append(knn.score(X_test, y_test))
Code
train_scores
[1.0,
 0.8099173553719008,
 0.7727272727272727,
 0.743801652892562,
 0.7603305785123967,
 0.7520661157024794,
 0.743801652892562,
 0.7231404958677686,
 0.71900826446281,
 0.6942148760330579,
 0.7272727272727273,
 0.6983471074380165,
 0.6900826446280992,
 0.6942148760330579,
 0.6859504132231405,
 0.6735537190082644,
 0.6859504132231405,
 0.6652892561983471,
 0.6818181818181818,
 0.6694214876033058]
Code
plt.plot(neighbors, train_scores, label = "train score")
plt.plot(neighbors, test_scores, label = "test score")
plt.xticks(np.arange(1,21,1))
plt.xlabel("number of neighbors")
plt.ylabel("model score")
plt.legend()

print(f"The best accuracy of the KNN model is {max(test_scores)*100:.2f} %")
The best accuracy of the KNN model is 75.41 %

hyperparameter tuning with randomizedsearchCV

we’re going to tune: * LogisticRegression() * RandomForestClassifier()

using randomizedsearchCV

Code
# create hyperparamter grid for logisticRegression
log_reg_grid = {"C" : np.logspace(-4,4,20),
               "solver" : ["liblinear"]}

#create hyperparameter grid for RandomSearchCV
rf_grid = {"n_estimators" : np.arange(10,1000,50),
          "max_depth" : [None, 3,5,10],
          "min_samples_split" : np.arange(2,20,2),
          "min_samples_leaf" : np.arange(1,20,2)}

lets use RandomizedSearchCV

Code
# tune logisticRegression 
  
np.random.seed(42)

# set up random hyperparameter for logisticRegression
rs_log_reg = RandomizedSearchCV(LogisticRegression(),
                               param_distributions=log_reg_grid,
                               cv =5,
                               n_iter = 20,
                               verbose = True)

#fit the model
rs_log_reg.fit(X_train, y_train)
Fitting 5 folds for each of 20 candidates, totalling 100 fits
RandomizedSearchCV(cv=5, estimator=LogisticRegression(), n_iter=20,
                   param_distributions={'C': array([1.00000000e-04, 2.63665090e-04, 6.95192796e-04, 1.83298071e-03,
       4.83293024e-03, 1.27427499e-02, 3.35981829e-02, 8.85866790e-02,
       2.33572147e-01, 6.15848211e-01, 1.62377674e+00, 4.28133240e+00,
       1.12883789e+01, 2.97635144e+01, 7.84759970e+01, 2.06913808e+02,
       5.45559478e+02, 1.43844989e+03, 3.79269019e+03, 1.00000000e+04]),
                                        'solver': ['liblinear']},
                   verbose=True)
In a Jupyter environment, please rerun this cell to show the HTML representation or trust the notebook.
On GitHub, the HTML representation is unable to render, please try loading this page with nbviewer.org.
Code
rs_log_reg.best_params_
{'solver': 'liblinear', 'C': 0.23357214690901212}
Code
rs_log_reg.score(X_test, y_test)
0.8852459016393442
Code
# tune RandomForestClassifier
  
np.random.seed(42)

# set up random hyperparameter for randomforestclassifier
rs_rf= RandomizedSearchCV(RandomForestClassifier(),
                               param_distributions=rf_grid,
                               cv =5,
                               n_iter = 20,
                               verbose = True)

#fit the model
rs_rf.fit(X_train, y_train)
Fitting 5 folds for each of 20 candidates, totalling 100 fits
RandomizedSearchCV(cv=5, estimator=RandomForestClassifier(), n_iter=20,
                   param_distributions={'max_depth': [None, 3, 5, 10],
                                        'min_samples_leaf': array([ 1,  3,  5,  7,  9, 11, 13, 15, 17, 19]),
                                        'min_samples_split': array([ 2,  4,  6,  8, 10, 12, 14, 16, 18]),
                                        'n_estimators': array([ 10,  60, 110, 160, 210, 260, 310, 360, 410, 460, 510, 560, 610,
       660, 710, 760, 810, 860, 910, 960])},
                   verbose=True)
In a Jupyter environment, please rerun this cell to show the HTML representation or trust the notebook.
On GitHub, the HTML representation is unable to render, please try loading this page with nbviewer.org.
Code
rs_rf.best_params_
{'n_estimators': 210,
 'min_samples_split': 4,
 'min_samples_leaf': 19,
 'max_depth': 3}
Code
rs_rf.score(X_test,y_test)
0.8688524590163934

Hyperparameter turning using GridSearchCV

Code
# different hyperparameter for our logisticRegression Model
log_reg_grid = {"C": np.logspace(-4,4,30),
                "solver":["liblinear"]
               }

np.random.seed(42)

#setup grid hyperparameter search for logisticRegression
gs_log_reg = GridSearchCV(LogisticRegression(),
                         param_grid=log_reg_grid,
                         cv =5,
                         verbose = True)

#fit our model
gs_log_reg.fit(X_train,y_train);
Fitting 5 folds for each of 30 candidates, totalling 150 fits
Code
# check best hyperparameter
gs_log_reg.best_params_
{'C': 0.20433597178569418, 'solver': 'liblinear'}
Code
gs_log_reg.score(X_test,y_test)
0.8852459016393442

Evaluating our tuned machine learning classfier, beyond accuracy

  • ROC curve and AUC score
  • Confusion matrix
  • Classification report
  • Precision
  • Recall
  • F1-score

To make comparisons and evaluate our trained model, first we need to make predictions

Code
# make prediction with tuned model
y_preds = gs_log_reg.predict(X_test)
Code
y_preds
array([0, 1, 1, 0, 1, 1, 1, 0, 0, 1, 1, 0, 1, 0, 1, 1, 1, 0, 0, 0, 1, 0,
       0, 1, 1, 1, 1, 1, 0, 1, 0, 0, 0, 0, 1, 0, 1, 1, 1, 1, 1, 1, 1, 1,
       1, 0, 1, 1, 0, 0, 0, 0, 1, 1, 0, 0, 0, 1, 0, 0, 0], dtype=int64)
Code
# plot ROC curve and calculate AUC score
RocCurveDisplay.from_estimator(gs_log_reg,X_test,y_test);

Code
# Confusion matrix 
print(confusion_matrix(y_test,y_preds))
[[25  4]
 [ 3 29]]
Code
sns.set(font_scale= 1.5)

def plot_conf_mat(y_test,y_preds):
    """
    PLots a nice looking confusion matrix using Seaborn's heatmap()
    """
    fig, ax = plt.subplots(figsize = (3,3))
    ax = sns.heatmap(confusion_matrix(y_test, y_preds),
                    annot = True,
                    cbar = False)
    plt.xlabel("True label")
    plt.ylabel("Predicted label")
    
plot_conf_mat(y_test,y_preds)

lets get classification report as well as cross-validated precision, recall and f1 score.

Code
print(classification_report(y_test,y_preds))
              precision    recall  f1-score   support

           0       0.89      0.86      0.88        29
           1       0.88      0.91      0.89        32

    accuracy                           0.89        61
   macro avg       0.89      0.88      0.88        61
weighted avg       0.89      0.89      0.89        61

Calculate evaluation metrics using cross validation

Code
# check best hyperparameters 
gs_log_reg.best_params_
{'C': 0.20433597178569418, 'solver': 'liblinear'}
Code
# create a new classifier with best params 
clf = LogisticRegression(C=0.20433597178569418,
                        solver = "liblinear")
Code
# cross validated accuracy
cv_acc = cross_val_score(clf, X, y, cv = 5, scoring= "accuracy")
cv_acc
array([0.81967213, 0.90163934, 0.8852459 , 0.88333333, 0.75      ])
Code
cv_acc = np.mean(cv_acc)
cv_acc
0.8479781420765027
Code
# cross validated precision
cv_precision =cross_val_score(clf, X, y, cv = 5, scoring= "precision")

cv_precision = np.mean(cv_precision)
cv_precision
0.8215873015873015
Code
# cross validated recall 
cv_recall = cross_val_score(clf, X, y, cv = 5, scoring= "recall")

cv_recall = np.mean(cv_recall)
cv_recall
0.9272727272727274
Code
# cross validated f1-score
cv_f1 = cross_val_score(clf, X, y, cv = 5, scoring= "precision")

cv_f1 = np.mean(cv_f1)
cv_f1
0.8215873015873015
Code
# visualize cross validated metrics 
cv_metrics = pd.DataFrame({"Accuracy": cv_acc,
                          "Precision" : cv_precision,
                          "recall" : cv_recall,
                          "f1-score" : cv_f1},
                          index = [0])
cv_metrics.T.plot.bar(title = "Cross validated evaluation metrics",legend = 0);

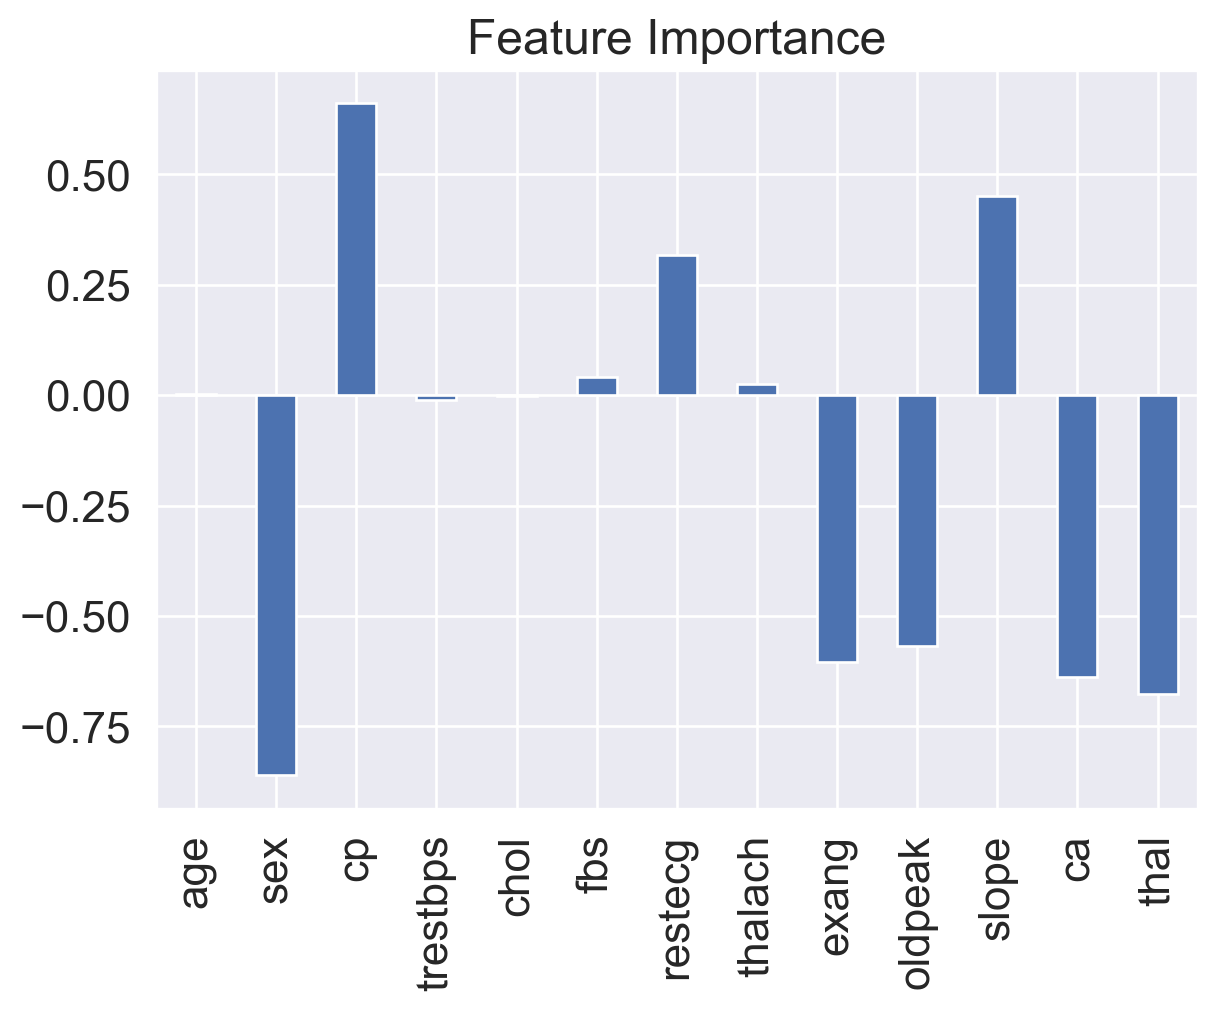
feature importance

Which feature contributed the most to the outcomes of the model and how did they contribute

Code
# fit an instance of logisticregressionabs
clf.fit(X_train,y_train);
Code
# check coef_
clf.coef_
array([[ 0.00320769, -0.86062047,  0.66001431, -0.01155971, -0.00166496,
         0.04017239,  0.31603402,  0.02458922, -0.6047017 , -0.56795457,
         0.45085391, -0.63733326, -0.6755509 ]])
Code
# match coef's of features to columns 
feature_dict = dict(zip(df.columns, list(clf.coef_[0])))
feature_dict
{'age': 0.0032076873709286024,
 'sex': -0.8606204735539111,
 'cp': 0.6600143086174385,
 'trestbps': -0.01155970641957489,
 'chol': -0.0016649609500147373,
 'fbs': 0.04017238940156104,
 'restecg': 0.3160340177157746,
 'thalach': 0.02458922261936637,
 'exang': -0.6047017032281077,
 'oldpeak': -0.567954572983317,
 'slope': 0.4508539117301764,
 'ca': -0.6373332602422034,
 'thal': -0.6755508982355707}
Code
# visualize feature importance
feature_df = pd.DataFrame(feature_dict,index=[0])
feature_df.T.plot.bar(title = "Feature Importance", legend = 0
                     );

6. Experimentation

If the evaluation metrics is not met:

  • Could you collect more data?
  • Could you try better model? like catboost or XGBoost?
  • Could we improve the current model ? (beyond what we have done so far)
  • if you meet your evaluation metrics, how would you share it with others?